Chart and graph differentiation (charts)
Charts include non-color-reliant text labels and descriptions to distinguish data points, and other relevant information.
Reliance on color:
This pie chart (and its corresponding aria-describedby description) relies on color to differentiate data:
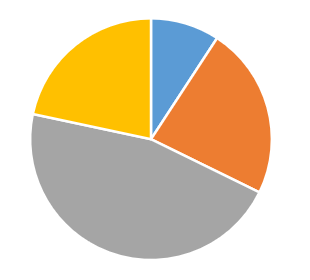
Pie chart description:
Orange = Apples
Blue = Lemons
Yellow = Cheeseburgers
Grey = Tobacco